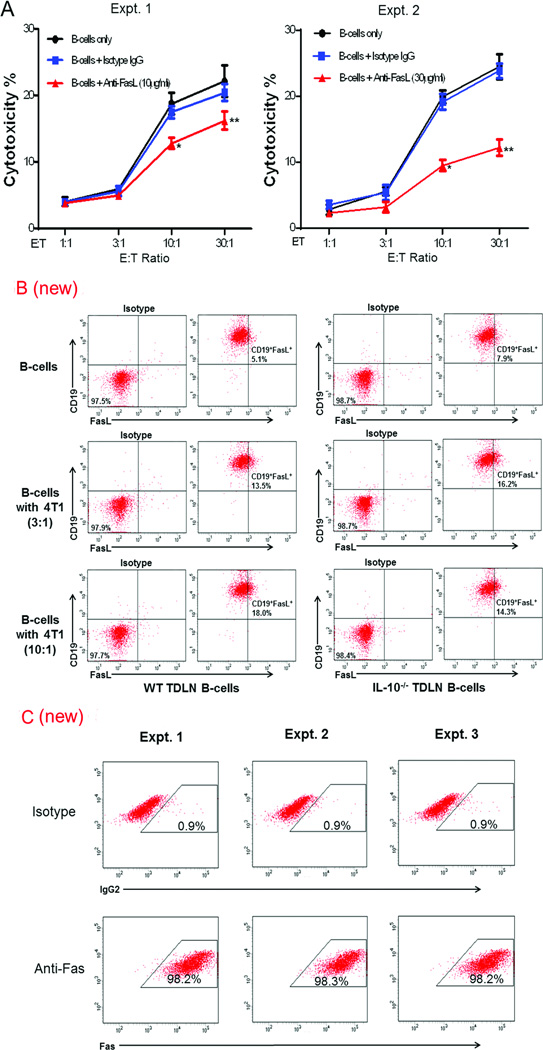
Figure 5.
Effect of Anti-FasL blockade on the cytotoxicity of 4T1 TDLN B cells against 4T1 tumor cells. (A) B cells were co-cultured with 4T1 tumor cells with or without the addition of anti-FasL mAb at 10 or 30 µg/ml. Cytotoxicity was plotted against the ratio of effector B cells: tumor target cells (E:T ratio) which were plated in triplicate wells. Results are shown as mean ± SEM of triplicate wells from a single experiment representative of three experiments performed. Differences between groups were examined for statistical significance by Student’s t-test. *p<0.02 or p<0.001, B cells + anti-FasL vs. B cells only or vs. B cells + isotype IgG at 10:1 in Expt. 1 and 2 respectively; **p<0.005 or p<0.0005, B cells + anti-FasL vs. B cells only or vs. B cells + isotype IgG at 30:1 in Expt. 1 and 2, respectively. (B) Detection of FasL in B cells purified from WT and IL-10−/− 4T1 TDLNs after A/E and co-cultured with 4T1 tumor cells. After A/E, B cells were co-cultured with 4T1 at the ratios of 3:1 and 10:1 (B cells : 4T1) for 12 h. B cells were then stained with anti-CD19 and anti-FasL antibodies. Representative plots out of two independent experiments are shown. (C) Detection of Fas on 4T1 tumor cells. 4T1 cells were stained with anti-Fas antibody. Cells were initially gated on forward and side scatter to remove debris and calculated by quadrant dot plot and at least 10,000 cells were analyzed by flow cytometry. Results from three independent experiments are shown.

