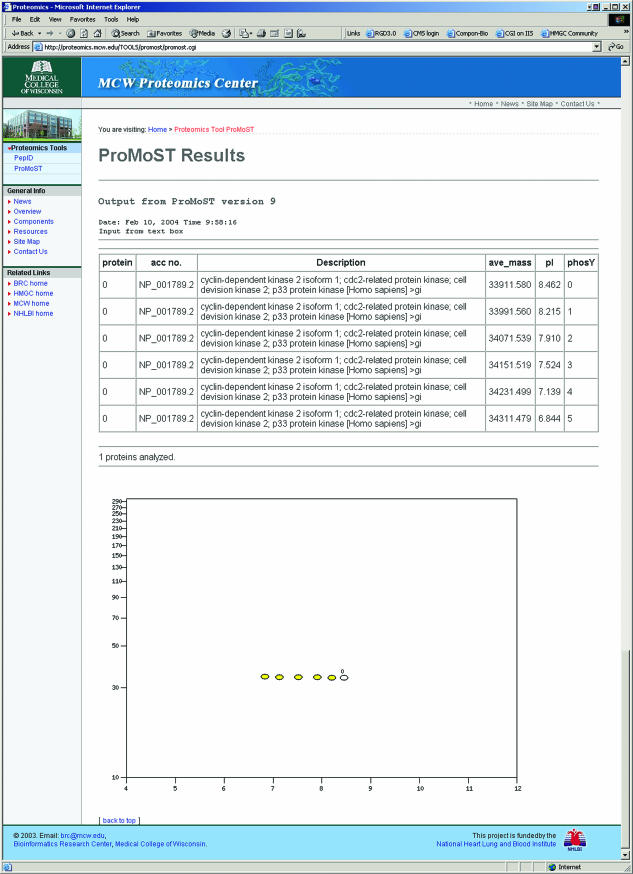
Figure 3.
ProMoST results output. The human CDK2 protein is used to illustrate the tabular and graphic output from the ProMoST program. The predicted migration of the parent protein is indicated as an open oval and the predicted migration of the phosphorylated proteins with one to five phosphotyrosines are indicated by yellow filled ovals. The vertical axis is molecular mass in kDa and the horizontal axis is pI values.

