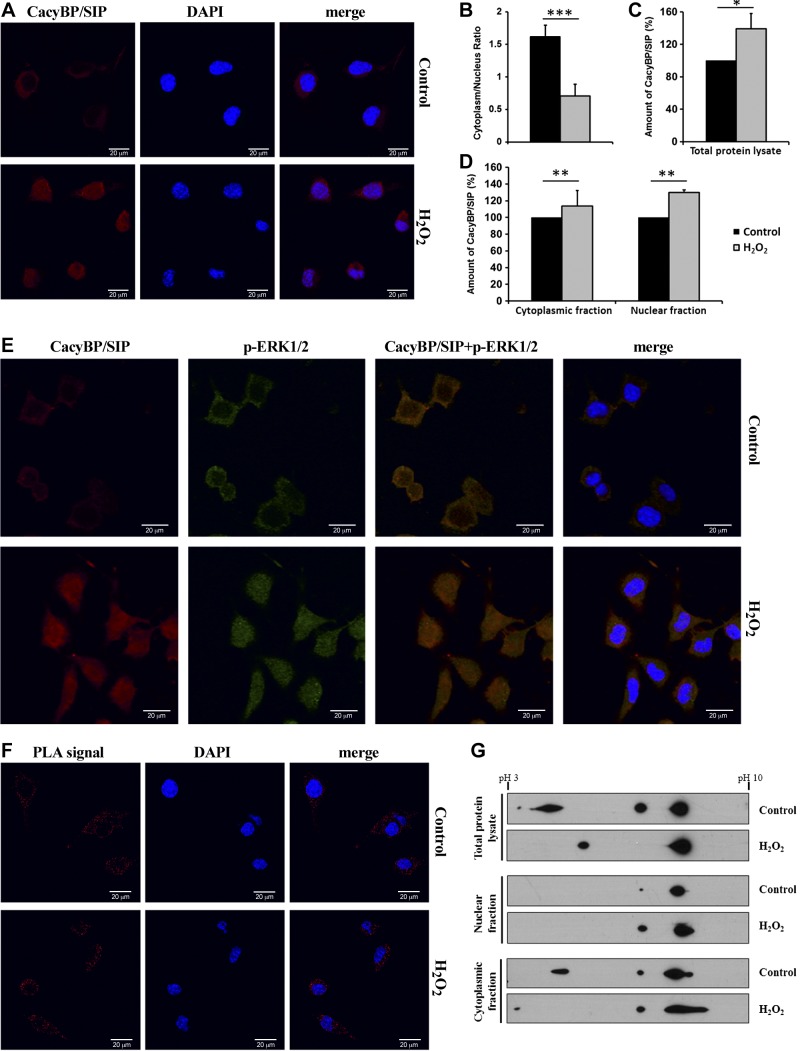
Figure 7.
Subcellular localization and properties of CacyBP/SIP in control and H2O2-treated NB2a cells. A) Immunofluorescence performed for CacyBP/SIP localization in untreated and H2O2-treated NB2a cells. CacyBP/SIP is marked in red, nuclei in blue. B) Statistical representation of CacyBP/SIP nuclear translocation (presented in A) shown as the ratio of cytoplasmic to nuclear immunofluorescence staining intensity in untreated (gray bar) and H2O2-treated (black bar) NB2a cells. Quantification was performed for all cells shown in panel A. C) Densitometric analysis of CacyBP/SIP level in the total protein lysate. Quantification was performed for the results obtained by Western blot from 3 independent experiments. D) Densitometric analysis of CacyBP/SIP level in the cytoplasmic and nuclear fractions in control and stress conditions. Quantification was performed for the results obtained by Western blot from 3 independent experiments. E) Colocalization of CacyBP/SIP with p-ERK1/2 in untreated and H2O2-treated NB2a cells. CacyBP/SIP is stained in red, p-ERK1/2 in green, while nuclei in blue. Colocalization of CacyBP/SIP and p-ERK1/2 is visible as yellow. F) Proximity ligation assay for homodimerization detection. Red PLA signal represents homodimers of CacyBP/SIP, and nuclei are marked in blue. G) Two-dimensional electrophoresis for CacyBP/SIP forms in different cellular compartments analyzed with Western blot using anti-CacyBP/SIP antibody.*P < 0.05; **P < 0.01; ***P < 0.001.

