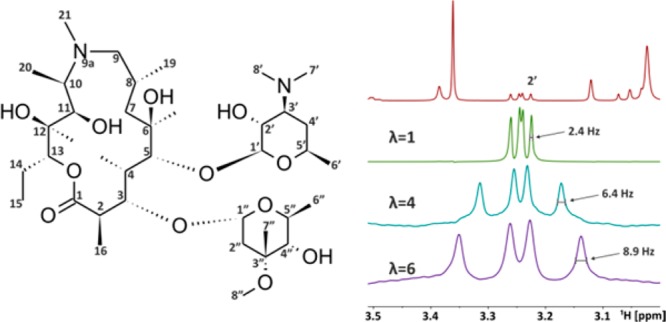
Figure 4.

Structure of azithromycin with its numbering scheme and the region around H-2′ in a regular 1D 1H NMR spectrum in CDCl3 (red), together with various H-2′ selectively excited, J-upscaled spectra. For the regular spectrum 32k data points, 16 scans, and a spectral width of 8 kHz were used, while 144 scans were accumulated for the upscaled spectra, with otherwise identical acquisition parameters. All spectra were processed with a 0.1 Hz exponential window function. It is possible to measure J without overlapping nearby signals.
