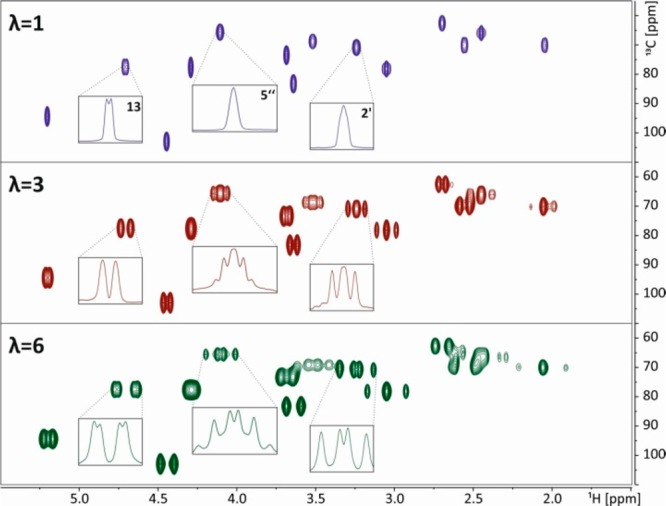
Figure 6.

Close-up image of the region between 55 and 110 ppm (13C) and between 1.5 and 6 ppm (1H) of a regular HSQC of azithromycin in CDCl3 is shown in blue. The 3-fold J-upscaled HSQC is shown in red and the 6-fold J-upscaled version in green. For all spectra data matrices of 1024 × 64 data points were recorded with 72 scans each. The spectral widths were 4 kHz (1H) × 21 kHz (13C). For λ = 3 the data chunks had a length of around 9 ms, and for λ = 6 the data chunks were ∼5 ms. All HSQCs were processed with sine square 90° window function after 3-fold zero filling along the direct dimension and zero filling to 256 points and the same window function in the indirect dimension. All peaks visible in this figure are multiplet components.
