Figure 2.
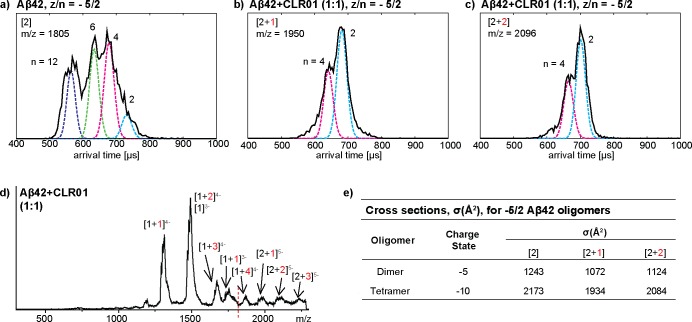
Effects of low concentration CLR01 on Aβ42 early oligomerization. ATDs of (a) z/n = −5/2 Aβ42 (m/z = 1805) in an Aβ42 sample without CLR01; (b) z/n = −5/2 Aβ42 and CLR01 complex (m/z = 1950); and (c) z/n = −5/2 Aβ42 and CLR01 complex (m/z = 2096) in a 1:1 mixture of Aβ42 and CLR01. Each ATD is fit with multiple features using the procedure described in the Experimental Methods section, and the oligomer order (n) is noted for each feature. (d) A mass spectrum of the 1:1 mixture of Aβ42 and CLR01 is shown as an example. Each species is noted in brackets where the first number is the number of Aβ42 molecules and the second number represents the number of bound CLR01 molecules. The charge is noted as a superscript. The dashed line represents the theoretical position for the uncomplexed −5/2 peak. Mass spectra of mixtures of Aβ42 and CLR01 with different ratios are shown in Figure S2 (Supporting Information). (e) Cross sections of dimer and tetramer in the uncomplexed or CLR01-complexed −5/2 Aβ42. The error for the cross sections reported here is between 0 and 1%.

