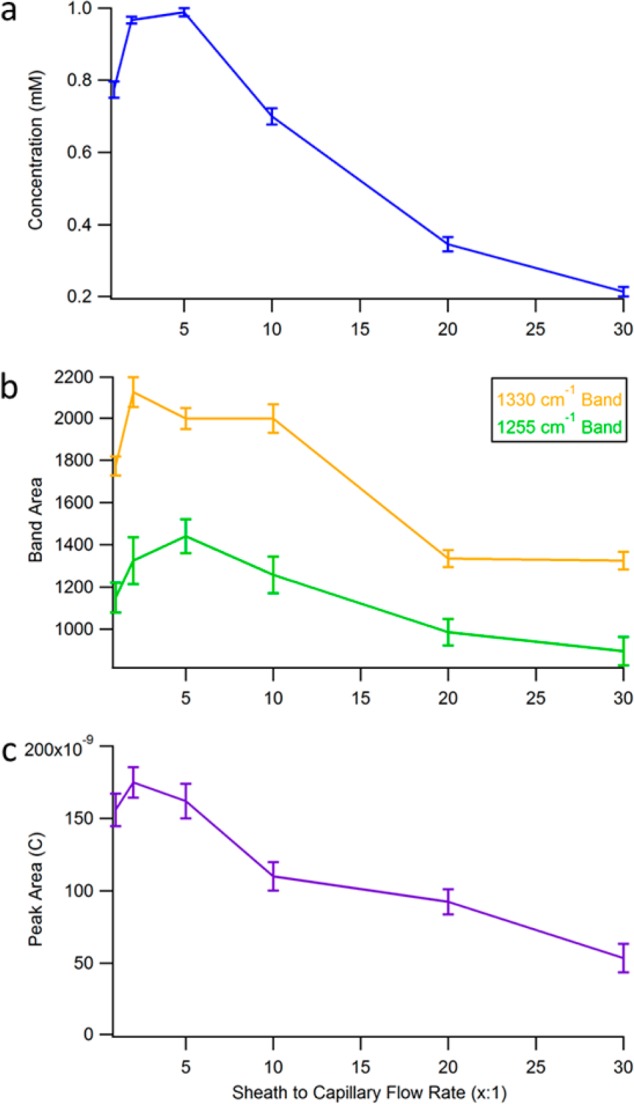
Figure 4.

A comparison of the (a) COMSOL simulation, (b) amperometry, and (c) SERS detection results with varying sheath to capillary flow rates demonstrating the focusing effect. (a) Shows a plot of the average concentration within the electrode regime at each flow ratio from the simulations. (b) Shown here is a plot of the band area of two characteristic frequencies of 1.0 μm riboflavin, 1255 and 1330 cm–1, versus the flow ratio. (c) A plot of the area of the amperometric peak obtained from 100 nL injections of 100 μM riboflavin at varying flow ratio is shown. All three plots demonstrate that the optimal sample confinement comes from a flow ratio of between 2:1 and 5:1.
