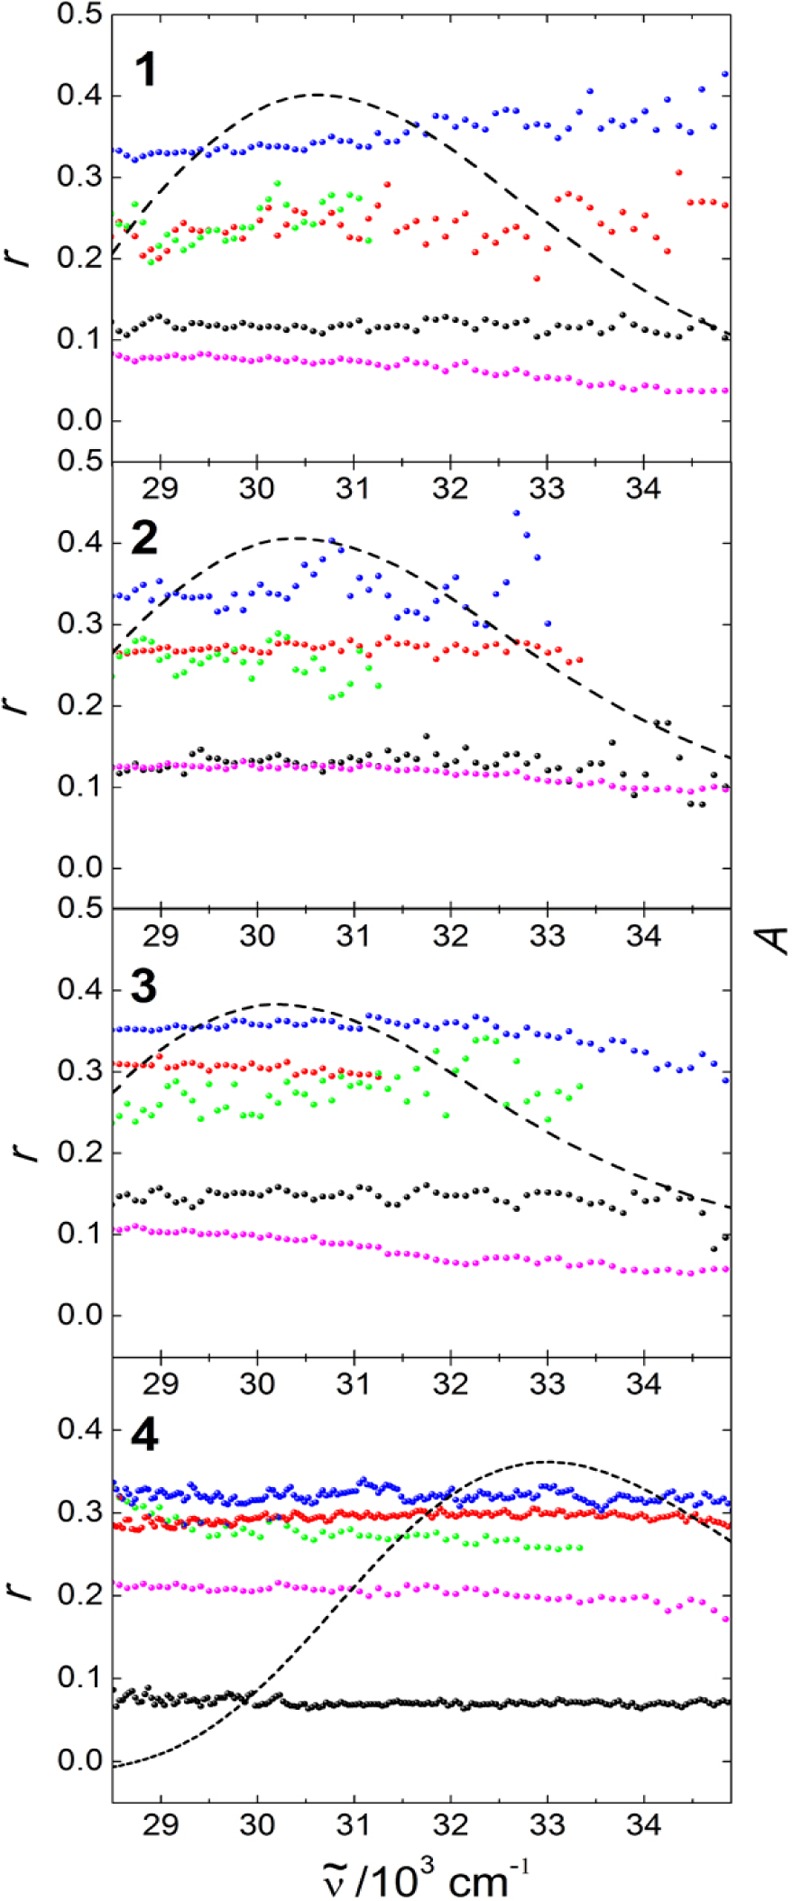
Figure 9.

Steady state fluorescence excitation anisotropy of 1–4 in solution in 2-MeTHF at RT (black) and 77 K (blue), and in aqueous suspension of neat crystallites (magenta) and of inclusions in TPP: 2%@TPP (red) and 0.02%@TPP (green). Emission frequencies monitored are listed in Table 4. Dashed black lines show the absorption spectra in 2-MeTHF at RT.
