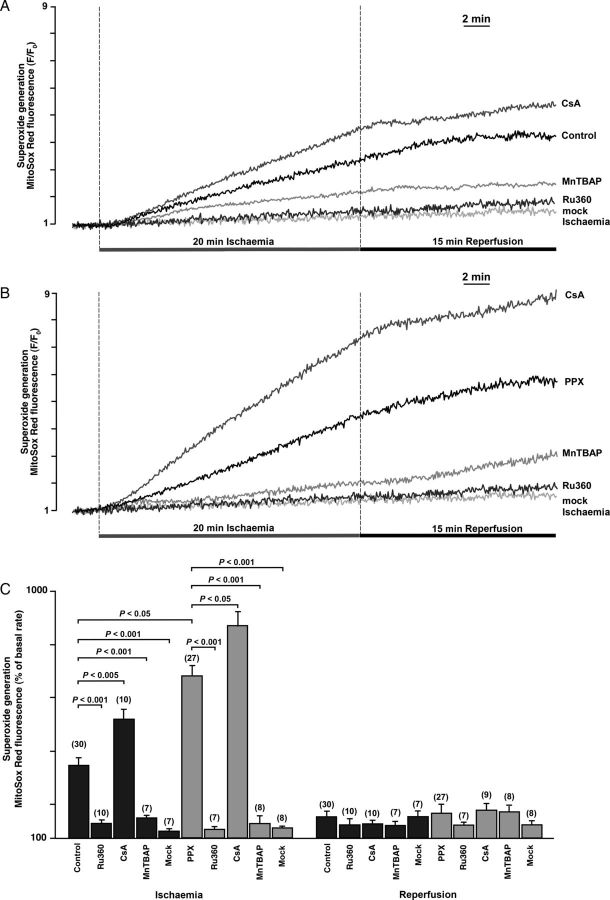
Figure 3.
(A and B) Superoxide generation measured with MitoSox Red during I/R in control (A, n = 30 cells, 10 animals) and polyP-depleted (B, PPX, n = 27 cells, 8 animals) cells in the absence and presence of 1 µM Ru360 (n = 10 cells from four animals in control + Ru360; n = 7 cells, three animals in the PPX + Ru360 group), 1 µM CSA (n = 10 cells, three animals in control + CSA; n = 9 cells, three animals in the PPX + CSA group), and 50 µM MnTBAP (n = 7 cells, three animals in control + MnTBAP; n = 8 cells, three animals in the PPX + MnTBAP group). ‘Mock’ ischaemia solution did not contain NaCN (n = 7 cells, three animals in control; n = 8 cells, three animals in the PPX group). (C) Average amplitude of MitoSox Red fluorescence changes at the end of ischaemia and at the end of reperfusion in control and polyP-depleted cells.

