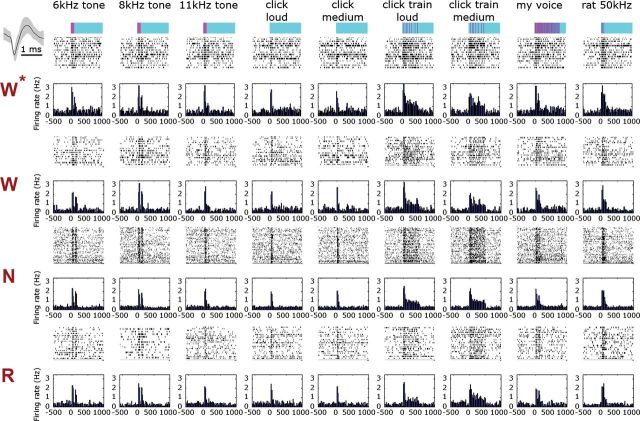
Figure 6.
Representative auditory single-unit responses across vigilance states. (A) Representative auditory responses of a single-unit across vigilance states (rows) for 9 different stimuli (columns). Rows (top to bottom) correspond to stimuli names and intensities, timing and structure of acoustic stimulus (pink over cyan), followed by raster plots and PSTHs for each vigilance state. Inset on upper left shows mean ± SEM of action potential waveform. W*, first wake trials; W, wakefulness trials; N, NREM sleep trials; R, REM sleep trials. Firing rate in all bar graphs is expressed in terms of percent of wakefulness baseline and is shown with the same scale across all states and stimuli. Note that neuronal responses are nearly indistinguishable visually across vigilance states.

