
Figure 5. The impact of diet switch on faecal and urinary metabolic reaction networks.
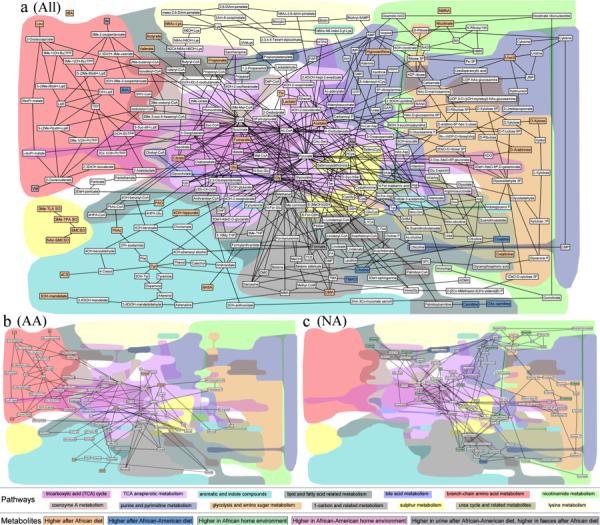
a-c) Metabolic reaction networks of metabolites found differentially expressed between different dietary comparisons, created using the MetaboNetworks software19 using information from KEGG on the reactions and enzymes within the biological system. The network shows links between metabolites if the reaction entry in KEGG indicates a main reactant pair and the reaction is either mediated by 1) an enzyme linked to human genes, 2) an enzyme linked to genes from identified bacterial groups using the HITChip or 3) it is part of a spontaneous process. The color of the metabolites indicate whether the metabolite is found in higher concentrations in the urine/feces of individuals consuming an African diet (orange), higher in individuals consuming an African-American diet (blue), higher in the African-American home environment (light red), higher in the African home environment (green) or whether the metabolites is not significantly associated with any comparison but is part of the metabolic network (white). Two metabolites (alanine and formate) are found with opposite associations in feces and urine (Table 2), these are therefore represented with a grey background color. A table with full names for each of the abbreviated metabolite names can be found in Supplemental Table 11. The background shading indicates different interconnected pathways. In the top part of the legend the color for each pathway, as represented in the figure, is shown. The bottom part of the legend, with black boxes around text box, indicates the association of each metabolite. a) Global network of changes (“All”) observed in fecal water and urine and in any comparison of the different groups. b) Network of fecal metabolites found differentially expressed in African-Americans before and after the dietary switch (“AA”). c) Network of fecal metabolites found differentially expressed in Africans before and after the dietary switch (“NA”).