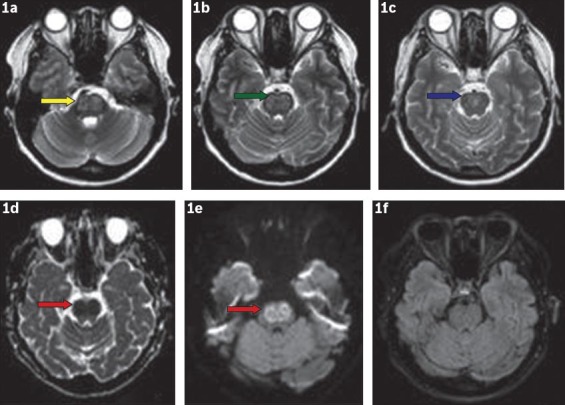
Fig. 1.

MR images of the brain show (a–c) symmetrical T2-W hyperintensities involving the pons (yellow/green arrow) and extending up to the lower midbrain (blue arrow). (d) Apparent diffusion coefficient image shows a hypointense lesion, which appears bright on (e) the diffusion-weighted image (red arrows). (f) Fluid attenuated inversion recovery image shows no abnormalities.
