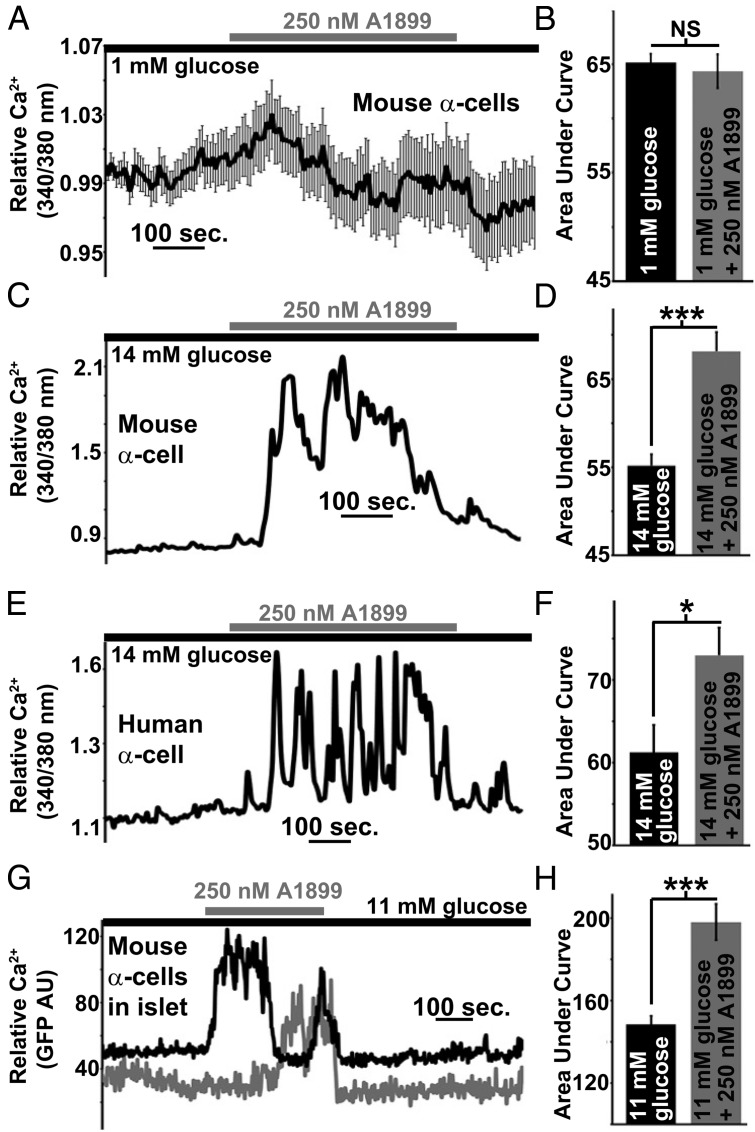
Figure 5.
Inhibition of α-cell TASK-1 significantly increases Ca2+ influx under high-glucose (14mM) conditions. A, Dispersed mouse α-cell Ca2+ response after TASK-1 inhibition with 250nM A1899 (gray bar) in the presence of 1mM glucose (±SEM). B, Area under the Ca2+ influx curve of mouse α-cells in 1mM glucose (black bar, 2-min time course) and in 1mM glucose with A1899 (gray bar) from 3 to 5 minutes after A1899 treatment (±SEM). C, Representative dispersed mouse α-cell Ca2+ response to 14mM glucose (black bar) followed by 250nM A1899 treatment (gray bar). D, Area under the Ca2+ influx curve of mouse α-cells in 14mM glucose (black bar, 2-min time course) and in 14mM glucose with A1899 (gray bar) from 3 to 5 minutes after A1899 treatment (±SEM; ***, P < .001). E, Representative dispersed human α-cell Ca2+ response to 14mM glucose (black bar) followed by 250nM A1899 treatment (gray bar). F, Area under the Ca2+ influx curve of human α-cells in 14mM glucose (black bar, 2-min time course) and in 14mM glucose with A1899 (gray bar) from 3 to 5 minutes after A1899 treatment (±SEM; *, P < .05). G, Representative mouse intact islet α-cell Ca2+ responses to 14mM glucose (black bar) followed by 250nM A1899 treatment (gray bar). H, Area under the Ca2+ influx curve of intact mouse α-cells in 14mM glucose (black bar, 2-min time course) and in 14mM glucose with A1899 (gray bar) from 3 to 5 minutes after A1899 treatment (±SEM; ***, P < .001).

