
Figure 2.
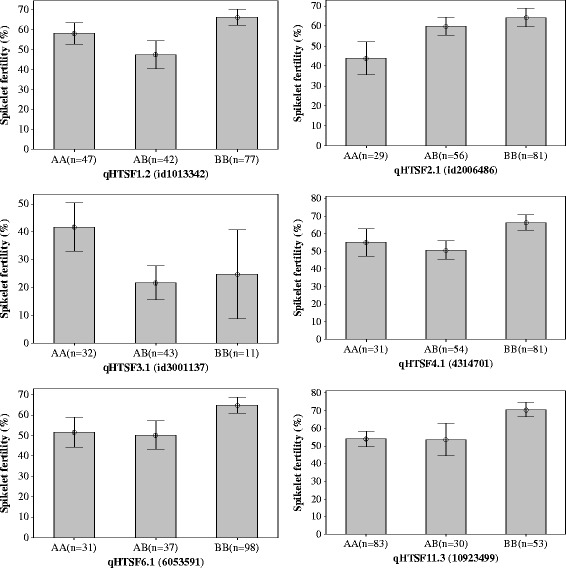
Interval plot of spikelet sterility of F2 progeny using SNP markers close to QTLs (peak of LOD score) of qHTSF1.2, qHTSF2.1, qHTSF3.1, qHTSF4.1, qHTSF6.1 and qHTSF11.3. The interval bar shows 95% confidence interval of the mean. qHTSF3.1 is from the IR64/Giza178 population, whereas the others are from the three-way population IR64//Milyang23/Giza178. Genotype AA = IR64, AB = heterozygote, BB = Milyang23 or Giza178.