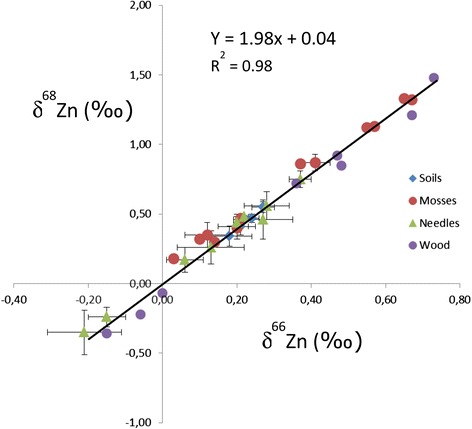
Figure 2.

Isotope plot obtained during measurements of the samples using δ6XZn= [((6XZn/64Zn)sample /(6XZn/64Zn)Lyon JMC 3-0749L)- 1] * 1000 (in ‰).

Isotope plot obtained during measurements of the samples using δ6XZn= [((6XZn/64Zn)sample /(6XZn/64Zn)Lyon JMC 3-0749L)- 1] * 1000 (in ‰).