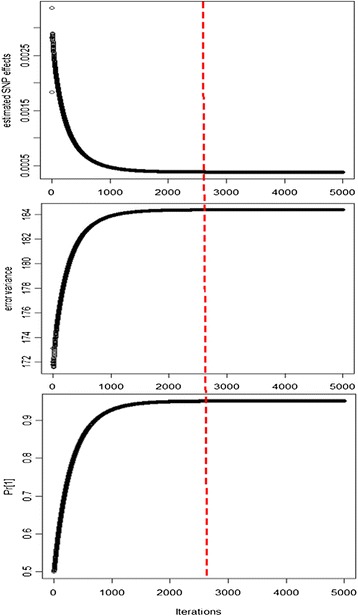
Figure 1.

Convergence of estimated SNP effects, error variance and Pr over 5000 iterations. The x axis represents the number of iterations that range from 0 to 5000; the y axis represents the estimated SNP effects, error variance and the first element of Pr (the proportion of SNPs in the distribution with zero variance).
