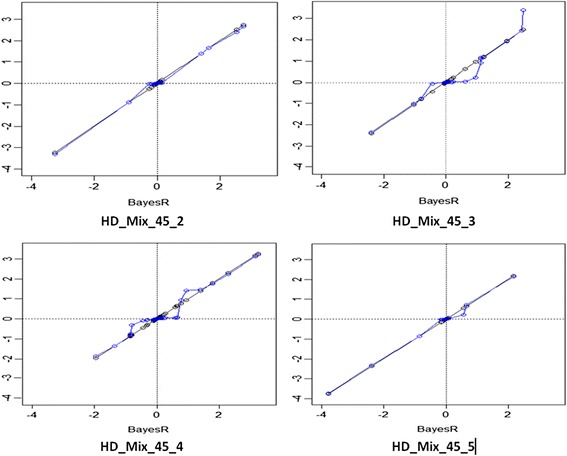
Figure 2.

Correlation between SNP effects from BayesR and emBayesR SNP effects in four replicates of HD_Mix_45 (h 2 = 0.45). The x axis represents the BayesR estimates of SNP effect; blue line plots emBayesR estimates of SNP effects on BayesR estimates of SNP effects; black line plots BayesR estimates of SNP effects on themselves for four replicates of HD_Mix with a heritability of 0.45.
