
Figure 6.
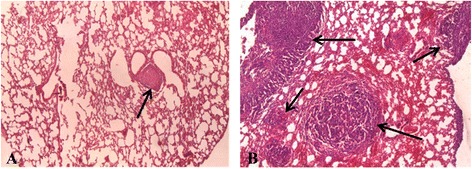
Histopathological analysis of lung tissue. Breast cancer metastases are shown by arrows. The image size is 235 × 175 μm. (A) ‘MET + MSCs’ group. (В) ‘MET’ group. Staining: hematoxylin-eosin. MET, MSC, mesenchymal stem cell.
Official websites use .gov
A
.gov website belongs to an official
government organization in the United States.
Secure .gov websites use HTTPS
A lock (
) or https:// means you've safely
connected to the .gov website. Share sensitive
information only on official, secure websites.
Histopathological analysis of lung tissue. Breast cancer metastases are shown by arrows. The image size is 235 × 175 μm. (A) ‘MET + MSCs’ group. (В) ‘MET’ group. Staining: hematoxylin-eosin. MET, MSC, mesenchymal stem cell.