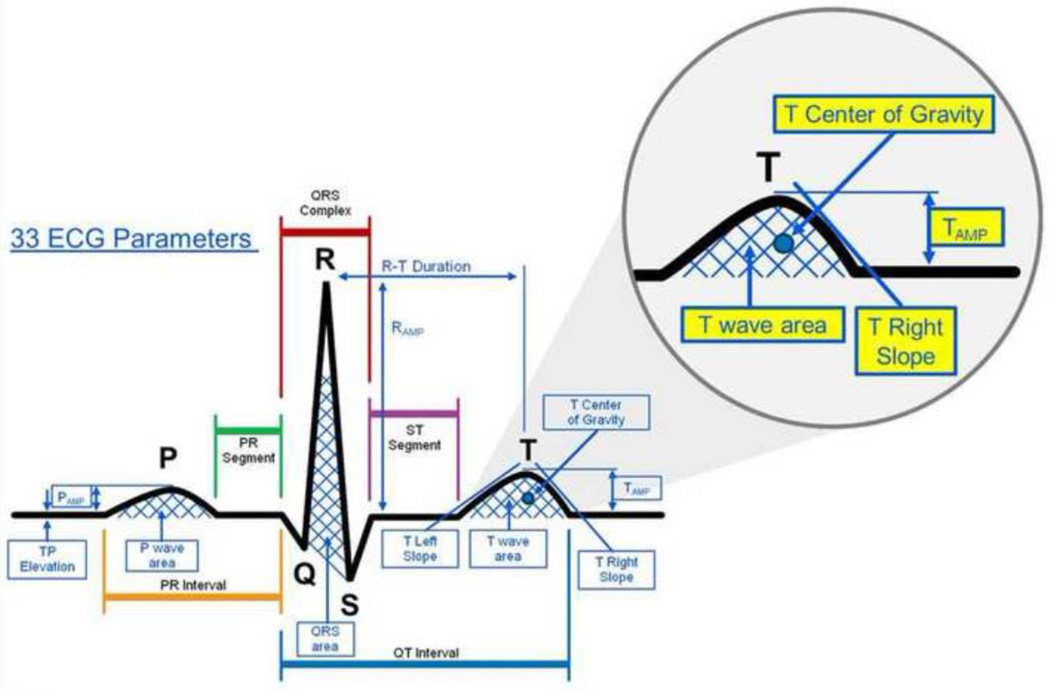
Figure 1. ECG parameters analyzed for correlation with potassium changes.
Large image: All measurable ECG parameters that were tested for sensitivity to potassium changes while recording ECG in dialysis patients at various potassium concentrations. Inset: Close-up view of parameters that had best correlation to changes in potassium: T center of gravity (T Cog), Tamp- Amplitude of T wave, T wave area, T right slope. T/R amplitude is calculated based on the corresponding values of the T wave area and R wave area shown in figure. T4 Cog is the latter 25% of the area under the T wave.

