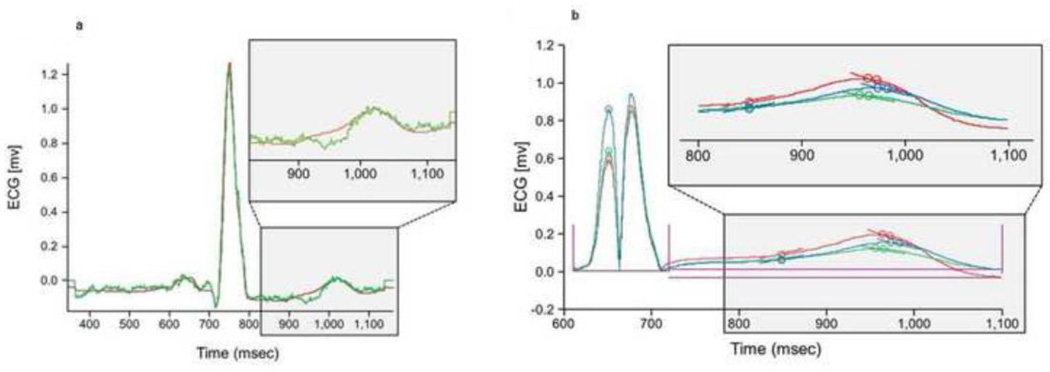
Figure 2. Mathemathematical Processing of ECG Signals.
Panel A) Depicts the averaged raw original versus processed ECG averaged signal for a given patient. The green tracing shows difference between a raw and a processed signal; this is the pre-processed signal. The red tracing is the averaged ECG signal after ECG processing algorithm was performed by exclusion based on R-R interval and amplitude deviations, template matching, and covariance filtering to eliminate artifact and noise. Inset- zoomed in view of the T wave of both unfiltered and filtered tracings. Panel B) Depicts multiple ECG averaged signals from a single patient at various potassium concentrations. Three examples are shown that display time-aligned, rectified, and processed ECG signals at various times during dialysis in at various potassium concentrations (red, blue, green). Note that the dotted S wave is a positive transposition of the negative solid S wave in order to calculate from an absolute positive value. Inset- zoomed in version of T wave segment of all three ECG tracings. T-wave changes are clearly visible after processing, despite relatively minor potassium changes.

