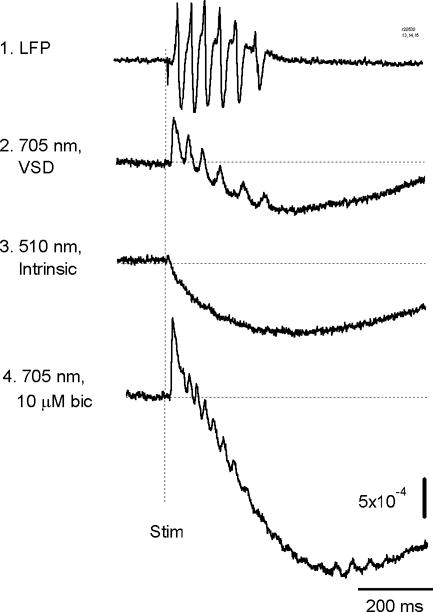
Figure 2.

Electrical and optical signals of the oscillation. Traces 1 and 2, simultaneous recording of local field potential (LFP) and optical signal from layer III, about 1 mm lateral to the stimulation site. Trace 3, optical signal at 510 nm of light from the same detector during another trial. Trace 4, optical signal from the same detector after the tissue was bathed with bicuculline. The optical signals were from one photo-detector which received light from an area of 83 × 83 μm (20x objective).
