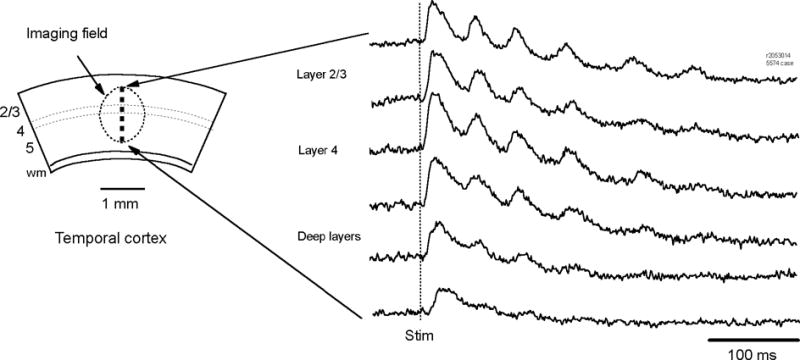
Figure 3.

Oscillation amplitude in different cortical layers. Voltage-sensitive dye signals (right traces) from 6 optical detectors imaging different cortical layers (left). The oscillation amplitude was high in Layer II-IV but low in deep layers. In contrast the first spike was seen in all the layers.
