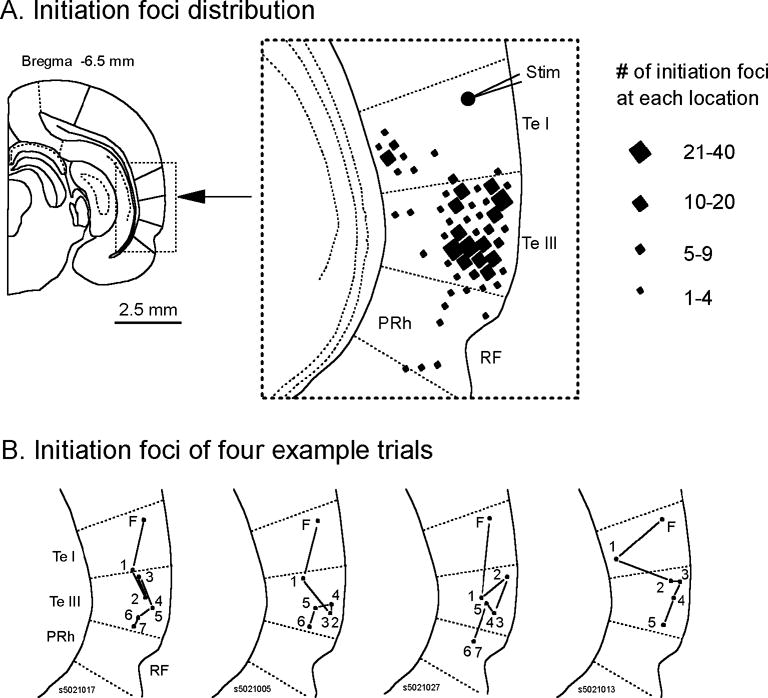
Figure 6.

Distribution of the initiation foci. A. Spatial distribution of the initiation foci of 352 oscillation cycles (first spike excluded) in one representative slice. The location of each focus is labeled by a diamond shaped mark. The size of the diamond mark represents the repeating occurrence at the each location (numbers at the right). The first spike always started at stimulation site (the round dot). All the subsequent oscillation cycles were not initiated near the stimulation site. The majority of the initiation foci are located in temporal cortex III area and a large portion of them was clustered at a few locations (larger diamonds). B. Initiation foci of four example trials from the slice shown in A. Numbers (1–7) indicate the sequence of the cycles following the first spike. While in all trials the first spike initiated at the same location (F, the stimulation site), the subsequent oscillation cycles were apparently initiated from randomly distributed locations.
