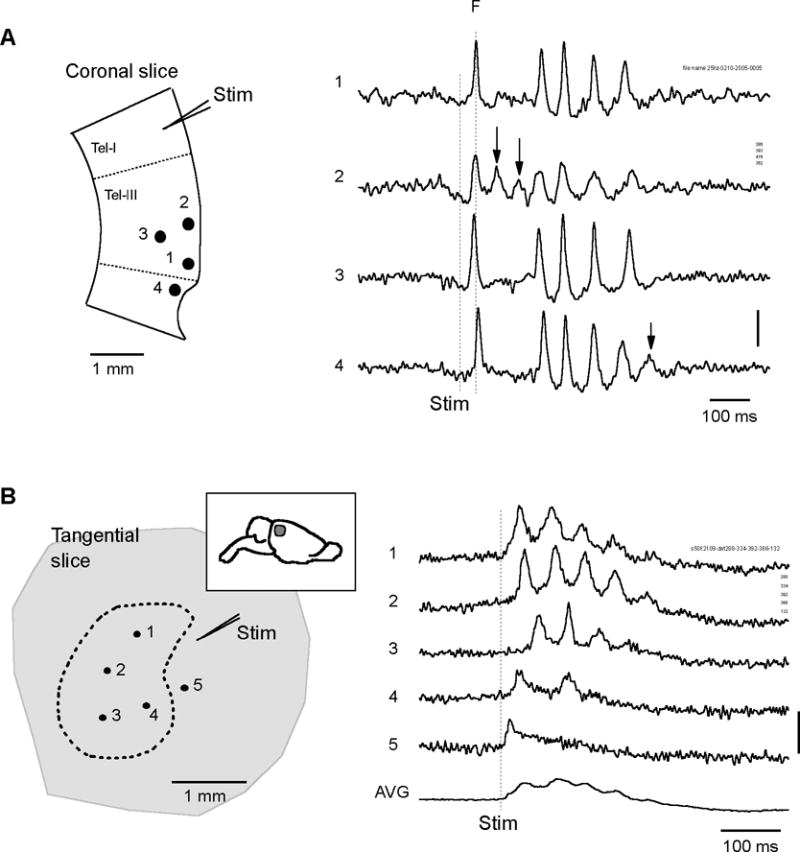
Figure 7.

Waveform variations over space. A. The voltage sensitive dye signals at four locations in a coronal slice (1–4, left) are shown (1–4, right). The first spike (broken line F) is seen at all locations. Extra oscillation cycles are seen at locations 2 and 4 (arrowheads). Signals are filtered between 3 – 200 Hz. Vertical scale: 2×10⁻⁴ of resting light intensity. B. An example of oscillations in tangential slices. Left, The slice was sectioned parallel to the cortical surface, 500 μm thick including part of layer II–III and IV (location of the slice shown on the insert). Oscillations were seen in an area marked by the dashed line on about ~160 detectors. Traces from five detectors (1–5) are shown on the right. Right, At different locations (1 – 4) there are different number of cycles. Outside the boundary of the dashed line there was only the first spike but no subsequent oscillation cycles (trace 5 on the right). Trace AVG, an average of all the ~160 detectors show largely reduced oscillation amplitude, suggesting the whole population was not synchronized. Vertical scale: 2×10⁻⁴ of resting light intensity. Signals are filtered between 1 – 200 Hz.
