Figure 1.

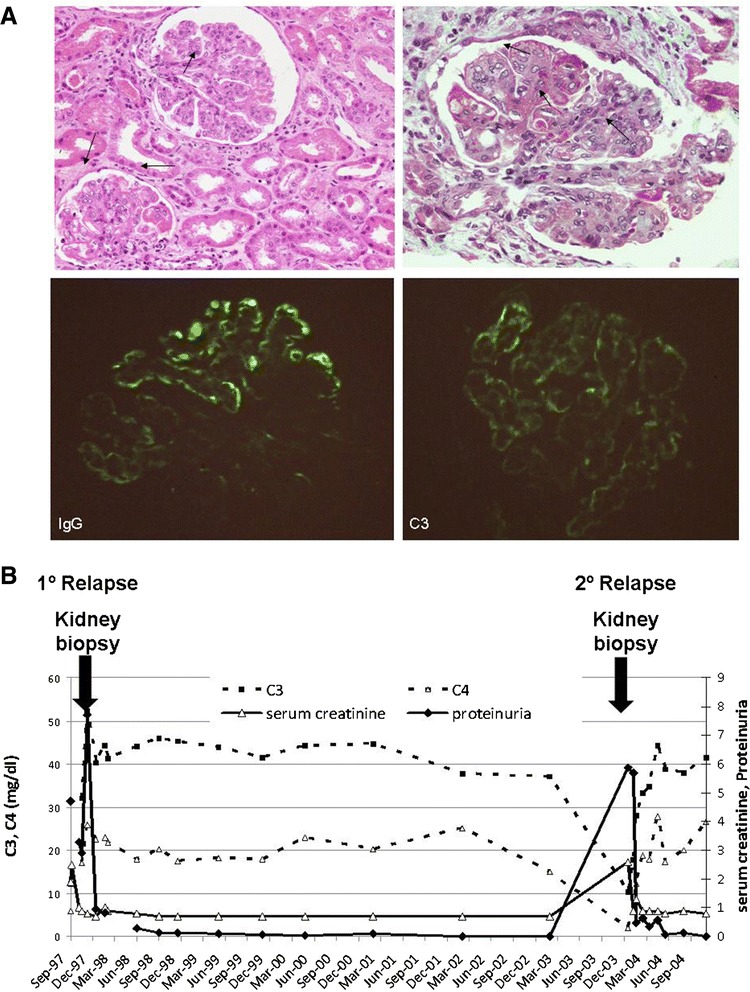
First kidney biopsy images, and renal function and complement evolution over 7 years. A) Light microscopy showing a glomerulus with endocapillary hipercellularity and karyorrhexis [hematoxylin-eosin (HE)], upper left panel. Light microscopy showing glomerular subendothelial deposits with wire loops lesions (masson trichrome), upper right panel. Immunoflourescence micrograph showing granular IgG deposits in the glomerular capillary walls, in a diffuse and global distribution, bottom left panel. Immunoflourescence micrograph showing subendothelial deposits of C3, bottom right panel. B) Seven year evolution of C3 and C4 levels, serum creatinine and proteinuria. Arrows indicate hospitalizations and renal biopsies due to nephrotic syndrome and renal insufficiency.
