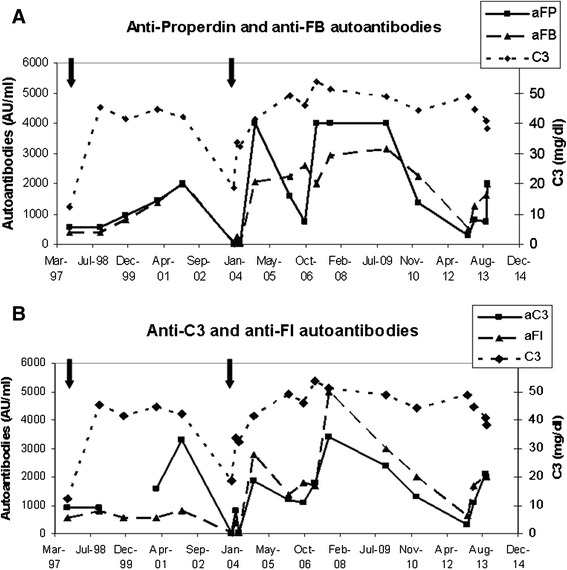
Figure 2.

C3 levels and autoantibodies titers follow up for a 16-year period. In A, anti-FB and anti-properdin autoantibodies are shown along with C3 levels, and in B, anti-FI and anti-C3. Black arrows indicate hospitalizations due to renal insufficiency and the time when renal biopsies were performed. C3 normal range: 75–150 mg/dl.
