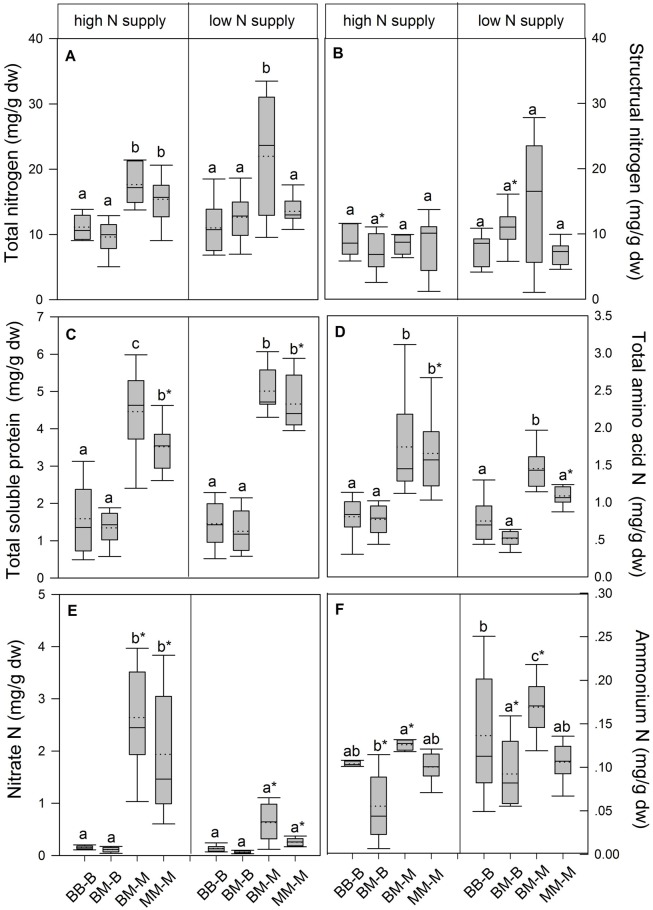
FIGURE 2.
Nitrogen pools (mg g-1 dw) in the fine roots of beech and sycamore maple seedlings with high or low soil N supply. (A) Total N, (B) structural N, (C) total soluble protein-N, (D) total amino acid-N, (E) nitrate-N, (F) ammonium-N. BB-B: beech grown in intra-specific competition, BM-B: beech grown in competition with sycamore maple, BM-M: sycamore maple grown in competition with beech, MM-M: sycamore maple grown in intra-specific competition. Box plots show means (dotted lines) and medians (straight lines; n = 14 for each treatment). Different small letters indicate significant differences between the competition regimes (i.e., BB-B, BM-B, BM-M, MM-M) within one soil N supply (P ≤ 0.050). Asterisks indicate significant differences between high and low soil N supply within one competition regime (P ≤ 0.050).

