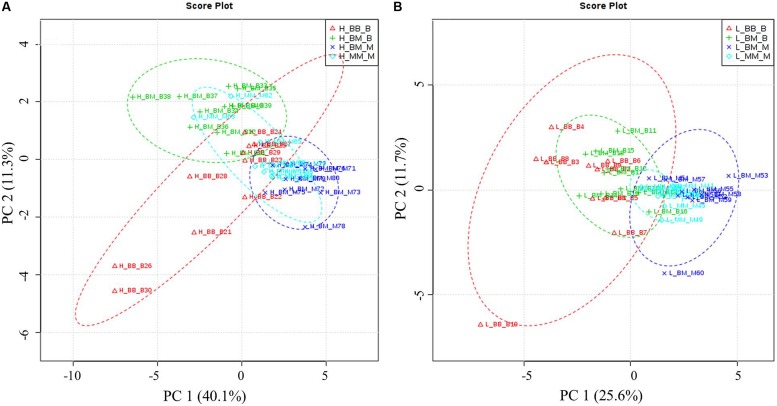
FIGURE 3.
Principal components analysis (PCA) based on specific amino acid concentration. H: with high soil N supply (A), L: with low soil N supply (B). BB-B: beech grown in intra-specific competition, BM-B: beech grown in competition with sycamore maple, BM-M: sycamore maple grown in competition with beech, MM-M: sycamore maple grown in intra-specific competition. (A) PCA of specific amino acids levels under high soil N supply. According to the variance of the specific amino acids along PC1 and 2 (capture 51.4% of the total variances), the groups of beech and maple under inter-specific competition were separated distinctly. (B) PCA of specific amino acids levels under low soil N supply. Beech and sycamore maple under inter-specific competition are grouped with a little part overlapped (PC1 and 2 explain 37.3% of variance).

