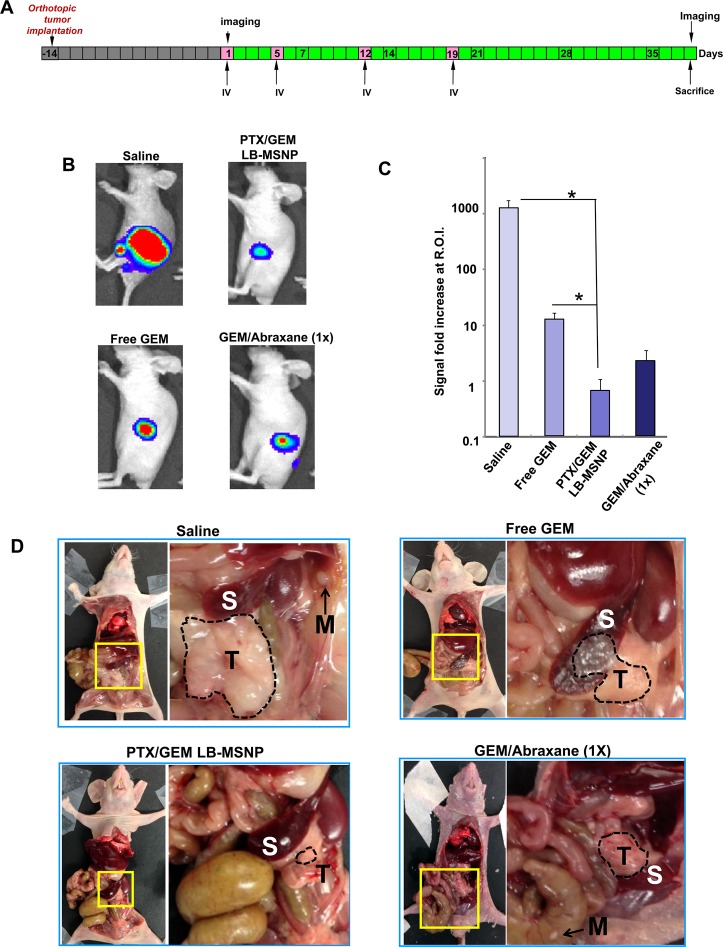
Figure 4.
Tumor growth inhibition in the orthotopic PANC-1 tumor model in nude mice. (A) Luciferase transfected PANC-1 cells were orthotopically implanted into the tail of the pancreas, 14 days before the commencement of treatment (gray boxes). These animals (n = 3) received four IV injections (pink boxes) every 3–6 days (green boxes), followed by a 19 day nonintervention time period. (B) IVIS optical imaging system was used to study the tumor growth in mice. To visualize tumor growth in vivo, anesthetized mice received IP injection of 75 mg/kg d-Luciferin, followed 8 min later by collecting bioluminescence data. Representative animal images, collected at day 38, are shown. (C) Bioluminescence intensity in the operator-defined region of interest (pancreas) was analyzed by Xenogen software and quantitatively expressed; *p < 0.05. (D) Representative photographs of animals in each group on which autopsy was performed. The primary tumor boundary is highlighted by a broken line: S, spleen; T, primary tumor; M, metastasis.

