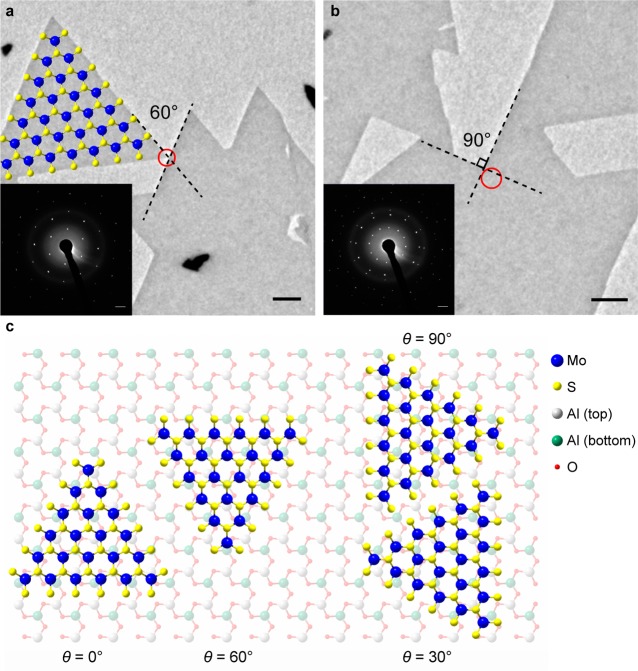
Figure 3.
Diffraction patterns from different island orientations. (a) Low-magnification TEM image of several neighboring MoS2 islands. The diffraction pattern acquired from the area denoted with the red circle is shown in the inset and corresponds to the most common arrangement between neighboring islands. Only one set of diffraction spots can be detected from such islands, indicating that their crystalline lattices are aligned. The MoS2 structure drawing indicates the lattice orientation within the single-crystal island and is not to scale. (b) Low-magnification TEM image and the corresponding diffraction patterns from two merging islands with their edges forming a 90° angle. Two sets of diffraction spots, rotated by 30°, can be observed, indicating a 30° lattice misorientation angle. (c) Schematic drawing showing the top view of relative lattice orientations between monolayer MoS2 and c-plane sapphire. In the case of the arrangement of the left-hand side, corresponding to lattice rotation angles θ = 0° and θ = 60°, the two lattices are commensurate. Two minority orientations can be observed in our sample, corresponding to a lattice rotation angle θ = 30° and θ = 90° (right-hand side).

