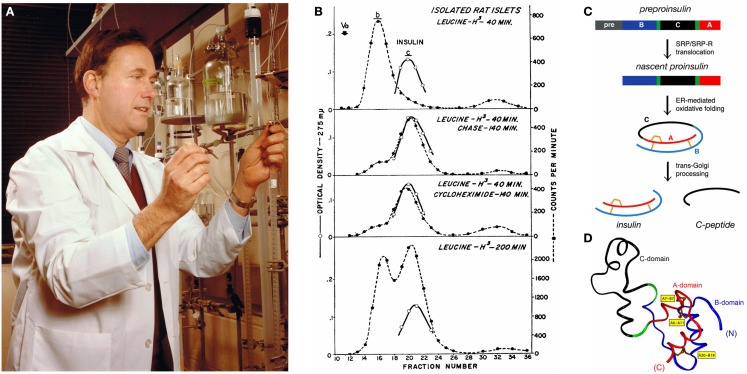
Figure 1.
Discovery of proinsulin. (A) Steiner in his laboratory at the University of Chicago in the mid-1970s. Gel-filtration column chromatography enabled separation of proinsulin, insulin, and C-peptide. (B) Chromatograms documenting the transformation of proinsulin to insulin in isolated islets of Langerhans as described in the landmark paper of 1967 (1). Top panel, elution pattern of 3H-Leu labeled acid-alcohol soluble protein extracted after incubation for 40 min. Middle two panels, transfer of radioactivity from peak b (proinsulin) to c (insulin) during subsequent 140 min in presence, respectively, of cycloheximide or 100-fold excess of unlabeled l-leucine. Bottom panel, pattern of radioactivity after 200 min incubation without intervention. Optical density (vertical axis at left) pertains to added bovine insulin as control. Chromtography employed G-50 Sephadex. (C,D) Biosynthesis of proinsulin. (C) Pathway begins with preproinsulin (top): signal peptide (gray), B-domain (blue), dibasic BC junction (green), C-domain (black), dibasic CA junction (green), and A-domain (red). Specific disulfide pairing in the ER yields native proinsulin (middle panels). BC and CA cleavage (mediated by prohormone convertases PC1 and PC2) releases insulin and C-peptide (bottom). (D) Solution structure of proinsulin: insulin-like moiety and disordered connecting peptide (black line). A- and B-domains are shown in red and blue, respectively; C-domain contains a nascent α-helical turn near the CA junction. Cystines are labeled in yellow boxes. This figure was obtained from Weiss (2) with permission of the author.

