Figure 6.
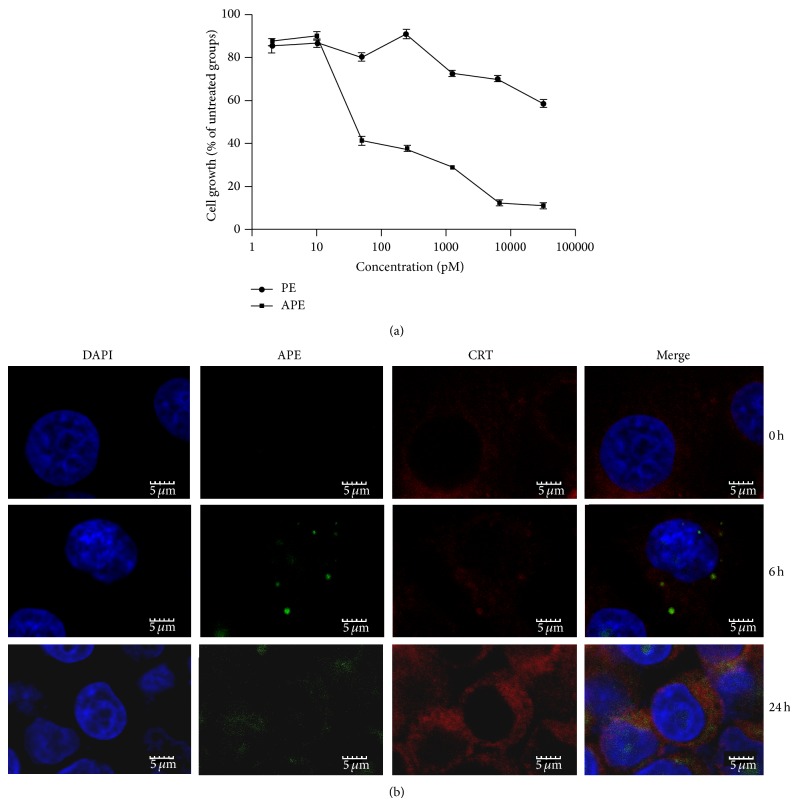
Cytotoxicity and localization of the immunotoxin. (a) HHCC cells were incubated with different concentrations (0.002, 0.01, 0.05, 0.25, 1.25, 6.5, and 32.5 nM) of the immunotoxin for 72 h, and cell growth was measured by MTT assay. (b) The localization of the immunotoxin was observed by laser scanning confocal microscopy at different incubation times (0, 6, and 24 h). DAPI indicates the cell nucleus; APE represents the immunotoxin; CRT is the calprotectin. All data are expressed as means ± standard deviations (SD).

