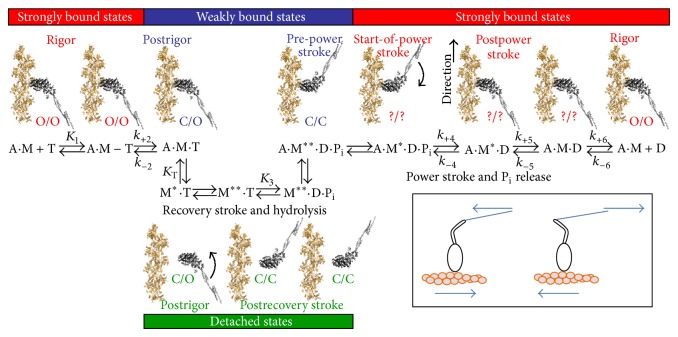
Figure 2.
Simplified schematic representation of the predominant biochemical and structural states of the actomyosin ATPase cycle. Actin is depicted in orange; the myosin motor domain with artificial lever arm (X-ray structure PDB:1G8X [358]) is shown in grey colors (A = actin, M = myosin motor domain, T = ATP, D = ADP, and P = Pi). The open (O) or closed (C) conformation of the active site elements switch 1 and switch 2 is indicated with switch 1 designated as the first. The power stroke corresponds to the switch 2 closed-to-open transition while the motor domain is bound to actin. The recovery stroke occurs in the detached state. It is assumed that the two heads of myosin act independently from each other and only one head is shown. Equilibrium constants and rate constants are denoted by upper case and lower case letters, respectively. Inset: Schematic illustration of tension in lever arm that causes muscle shortening (left) and that resists shortening (right).

