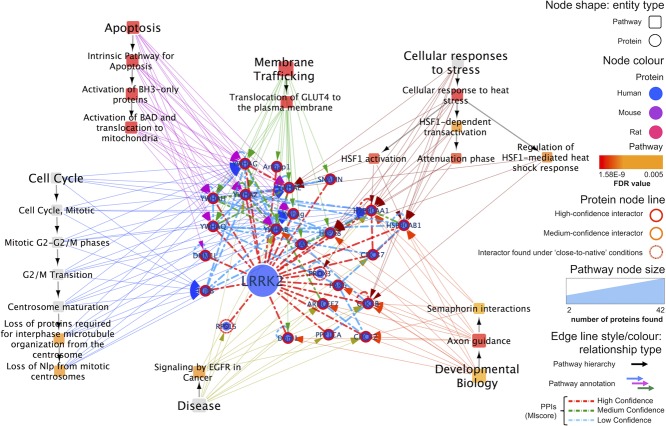
Figure 8.
LRRK2 high-confidence interacting partners analyzed using the Reactome analysis tool. LRRK2 high-confidence partners and the interactions between them are represented associated to Reactome pathways that appear to be significantly enriched for this group of proteins. Each pathway is associated with annotated proteins through colored arrows and Reactome's pathway hierarchy is shown using black arrows. See legend for the remaining visual features used in this representation. A web visualization of this network can be found at http://tinyurl.com/lrrk2-f8.

