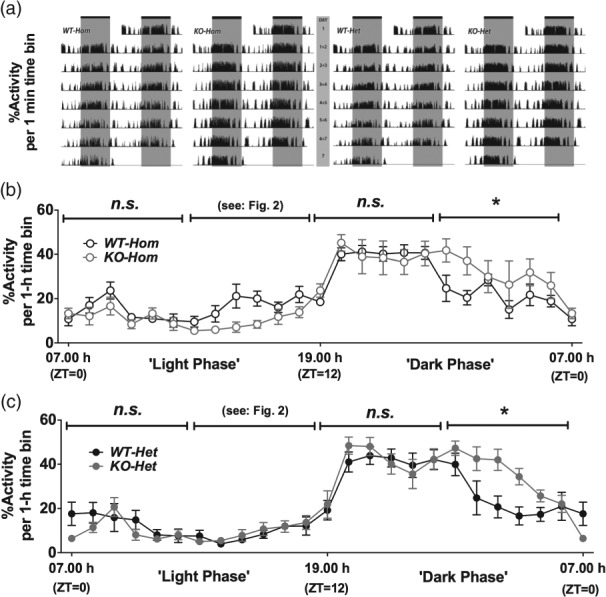
Figure 1.

Spontaneous motor activity across the 24 h light:dark cycle. (a) Double-plotted actograms displaying the % activity (per 1 min time bin) of one mouse from each group (WT-Hom, KO-Hom, WT-Het, KO-Het) across days 1–7, (b) mean % activity (per 1 h time bin) of WT-Hom mice and KO-Hom mice across the 24 h cycle, and (c) mean % activity (per 1-h time bin) of WT-Het mice and KO-Het mice across the 24 h cycle. (a) Areas in white represent the light phase of the 24 h light:dark cycle, whereas areas in grey represent the dark phase of the 24 h light:dark cycle. (b) and (c) Circles depict mean ± SEM for each hourly time-point and lines above the graphs represent 6 h time bins used for statistical analysis. For each individual animal, data from time-matched samples were pooled across six consecutive days to produce the mean ± SEM for each time bin (N = 1 for each animal; N = 5 per experimental group). The light intensity in the holding room was increased or reduced in steps between 07.00 h and 08.00 h and 19.00 h and 20.00 h, respectively; *P < 0.05; n.s., non-significant; ZT, zeitgeber time (light cue).
