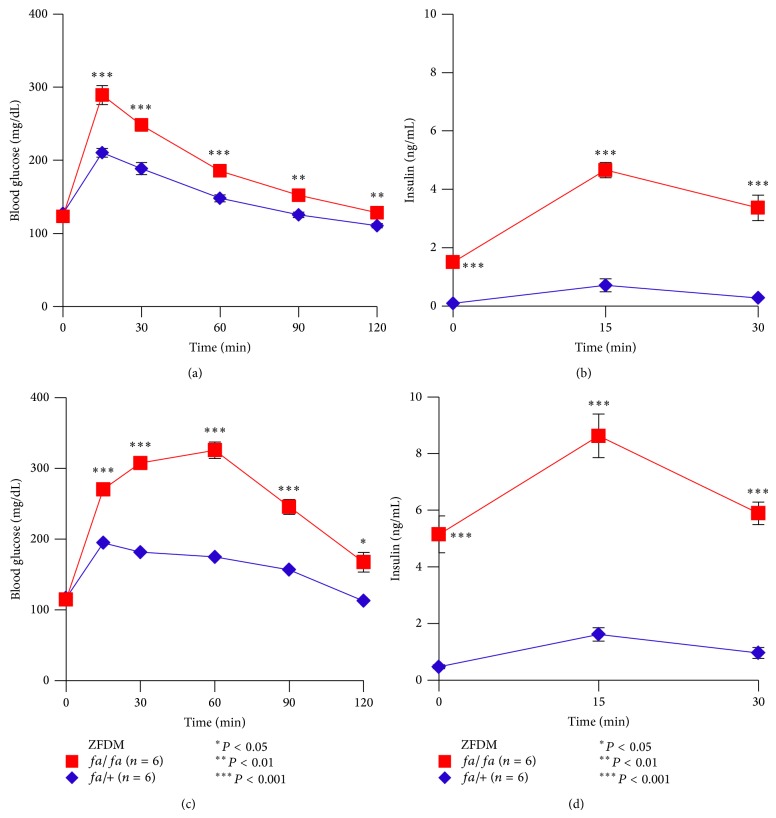
Figure 1.
Characterization of glucose tolerance of the ZFDM strain. (a) Blood glucose levels and (b) plasma insulin levels during OGTT at 7 weeks of age. (c) Blood glucose levels and (d) plasma insulin levels during OGTT at 11 weeks of age. The data are expressed as mean ± SEM. Welch's t-test was used for comparisons between fa/fa (red, n = 6) and fa/+ (blue, n = 6) rats.

