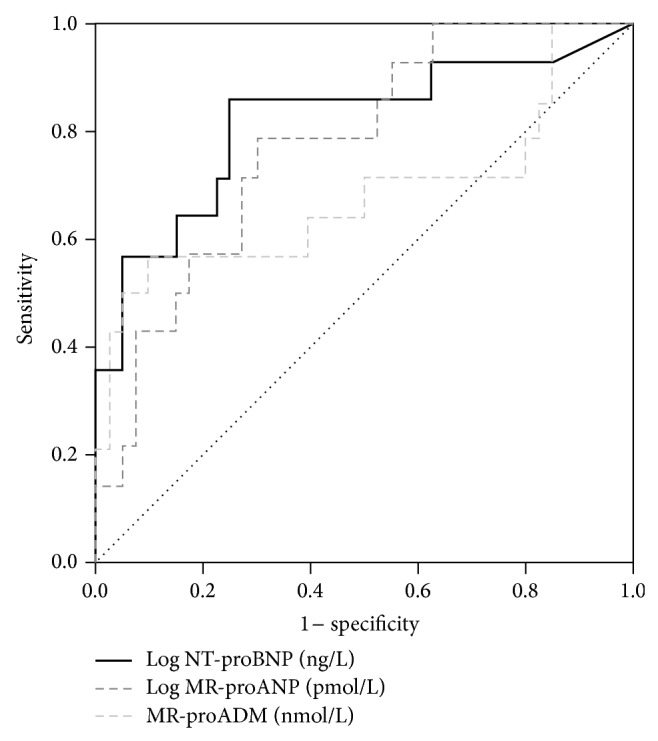
Figure 2.

ROC curves for the predictive value of NT-proBNP, MR-proADM, and MR-proANP for increased PWV (=8.6 m/sec, n = 14, 26%). The AUCs were as follows: NT-proBNP: 0.82, 95% CI 0.67 to 0.96; MR-proANP: 0.78, 95% CI 0.64 to 0.91; MR-proADM: 0.68, 95% CI 0.49 to 0.88. There was no significant difference between AUCs of each biomarker (all P > 0.05).
