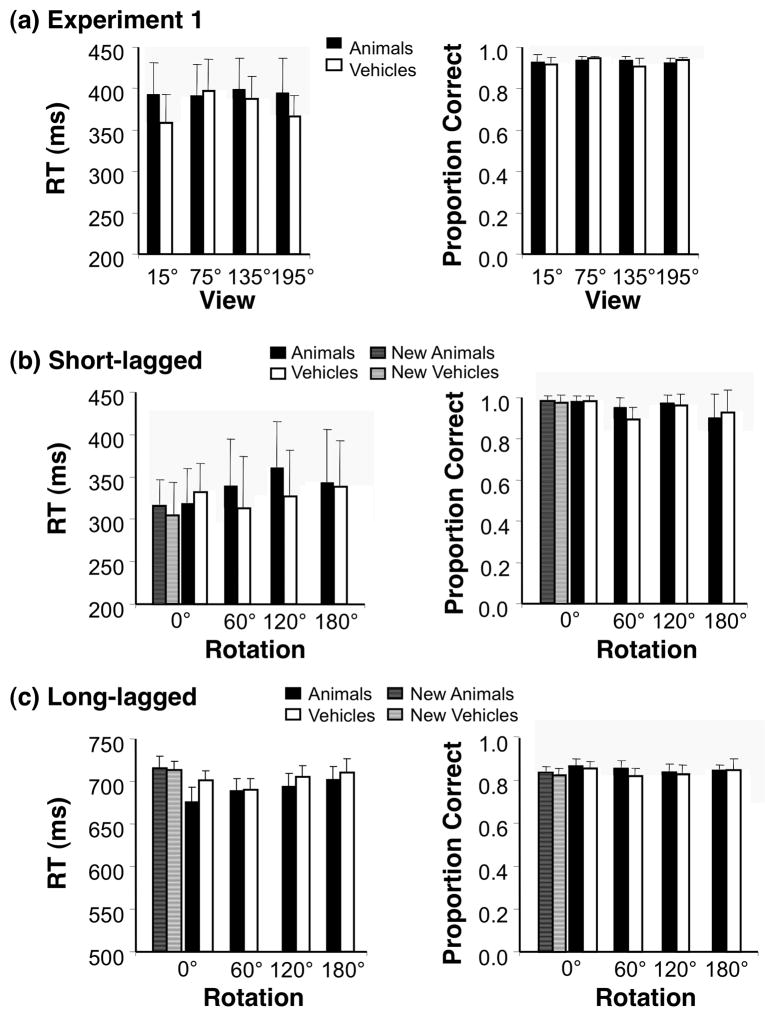
Figure 3. Behavioral Responses.
(a) Mean response time (RT) and accuracy (proportion correct) averaged across 8 subjects who participated in Experiment 1. Error bars indicate standard error of the mean (SEM). (b) Behavioral responses for the test stimulus (second stimulus in each pair) during the short-lagged fMRI-adaptation experiment averaged across 7 subjects. Error bars: SEM. (c) Behavioral responses for the test stimulus during the long-lagged fMRI-adaptation experiment averaged across 8 subjects. Error bars indicate SEM.

