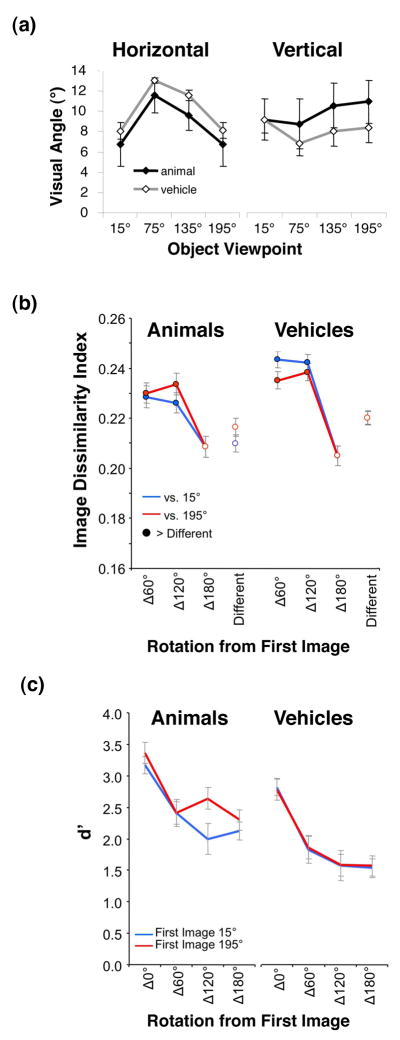
Figure 8. Stimulus size, pixel-wise dissimilarity & behavioral similarity.

a) Mean visual angle of stimuli measured horizontally (left) and vertically (right) for each category and viewpoint. Error bars represent one standard deviation across images. b) Average pixel-wise image dissimilarity between all adapting and test stimuli used in the experiments. Blue: versus the 15° view. Red: versus the 195° view. Rotated versions of the same object (filled circles) are more dissimilar (t-test, P < .05) than two different objects in the same view (Different condition). c) Subjects’ discrimination performance (d′) for the same-different discrimination task as a function of rotation.
