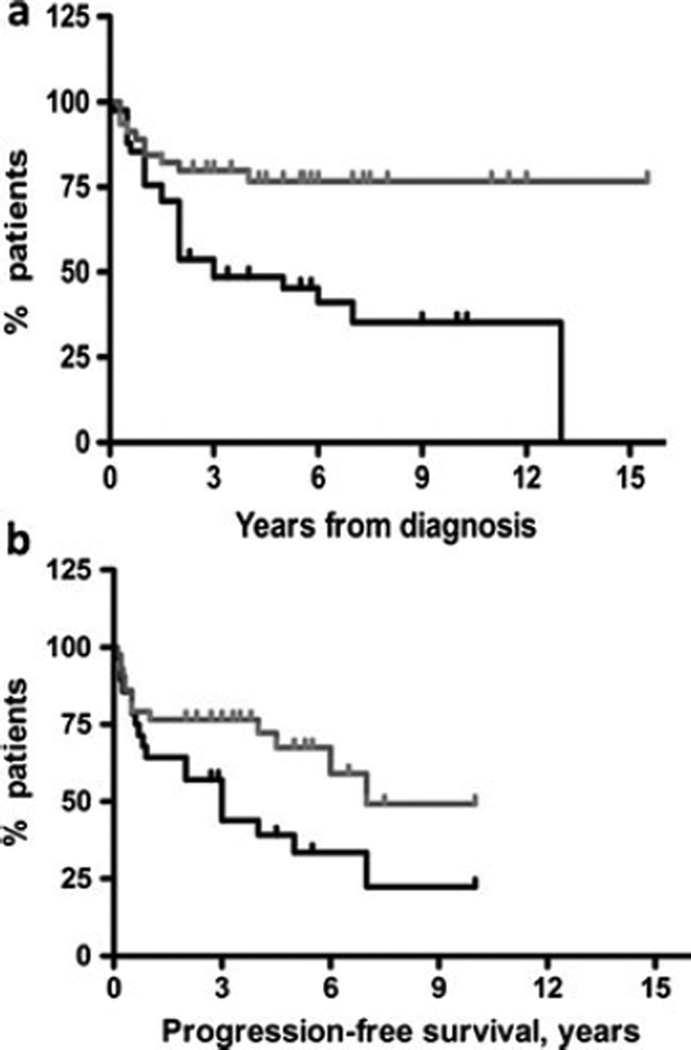
Fig. 2.
a Kaplan–Meier plot of survival (time period from the diagnosis to the endpoint) for low expression (gray line) and overexpression (black line) of FASN (p=0.002, HR=2.92, 95 % CI 1.180–5.803). b Kaplan–Meier plot of progression-free survival for low expression and overexpression of FASN (p=0.004, HR=3.96, 95 % CI 1.547–10.45). Notch denotes the censored data

