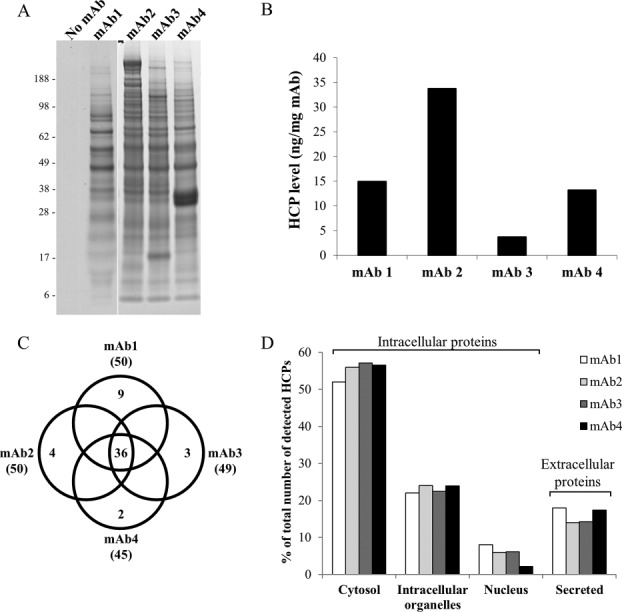
Figure 1.

Characterization of HCP interactions with mAbs. (A) SDS-PAGE profiles of HCPs from the null CHO cell supernatant that bound to mAb1, mAb2, mAb3, and mAb4 compared to no mAb control. (B) The levels of HCP that bound to each mAb as measured by ELISA. (C) Venn diagram comparison of the numbers of HCP species that bound in common or uniquely to each mAb. Total numbers of HCPs identified for each mAb are in parentheses. (D) Subcellular distribution of HCPs that bound to each mAb. The number of HCP species in each category is expressed as percentage of the total number of HCPs identified.
