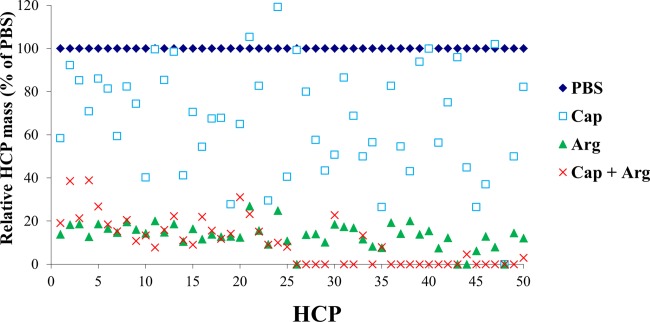
Figure 6.

Effects of combinations of wash modifiers on breaking interactions of individual HCP with mAb1. The levels of individual HCPs remaining after each indicated wash were obtained from mass spectrometry analysis and are expressed as a percentage of the levels after PBS control wash as described in Method section. The x-axis shows individual HCP species.
