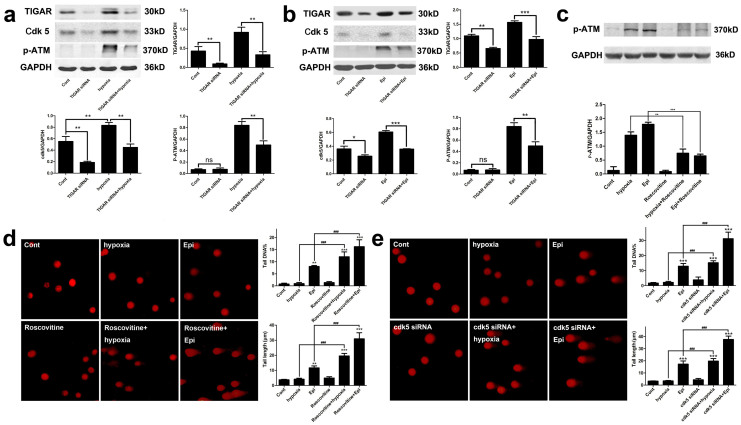
Figure 6. TIGAR protected DNA from damage through regulating Ckd5.
(a) Expression of Cdk5 and p-ATM protein after TIGAR knockdown in hypoxia condition. HepG2 cells or TIGAR knockdown HepG2 cells were treated with 200 mM CoCl2 and protein levels of Cdk5 and p-ATM were detected with Western blot analysis. GAPDH was used as a loading control. Quantitative analysis was performed with Image J. (b) Expression of Cdk5 and p-ATM protein after TIGAR knockdown cells were treated with epirubicin. HepG2 cells or TIGAR knockdown HepG2 cells were treated with 2.5 μg/ml epirubicin and protein levels of Cdk5 and p-ATM were detected with Western blot analysis. GAPDH was used as a loading control. Quantitative analysis was performed with Image J. (c) The Cdk5 inhibitor roscovotine inhibited ATM phosphorylation. HepG2 cells were treated with 200 mM CoCl2 or 2.5 μg/ml epirubicin and roscovotine was added 24 h before. Protein levels of phosphorylated ATM were detected with Western blot analysis. GAPDH was used as a loading control. Quantitative analysis was performed with Image J. (d) DNA damage of HepG2 cells after treatment with 200 mM CoCl2 or 2.5 μg/ml epirubicin when Cdk5 was inhibited by roscovotine. Left panel, representative images of Comet assay. Right panel, quantification of Comet tail DNA% and tail length. Values are means ± SD from 3 independent experiments. * p < 0.05, **p < 0.01, *** p < 0.001, ns p > 0.05 versus control group; ### p < 0.001 versus corresponding groups. (e) DNA damage of HepG2 cells after treatment with 200 mM CoCl2 or 2.5 μg/ml epirubicin when Cdk5 was knocked down by Cdk5 siRNA. Left panel, representative images of Comet assay. Right panel, quantification of Comet tail DNA% and tail length. Values are means ± SD from 3 independent experiments. *** p < 0.001 versus control group; ### p < 0.001 versus corresponding groups.

