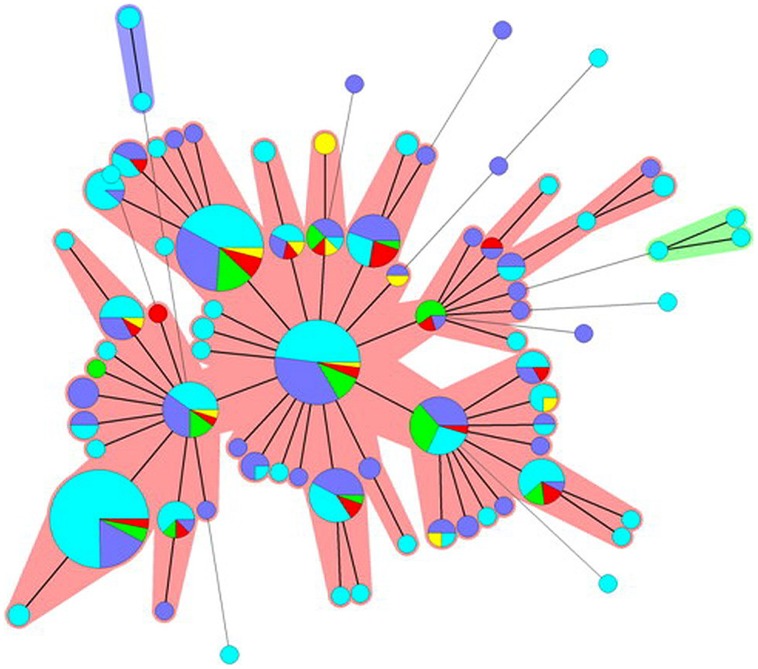
FIGURE 2.
Minimum spanning tree based on the MLVA profiles observed for S. Typhimurium isolates. Each node corresponds to a MLVA profile and each node size is proportional to the number of isolates displaying this particular profile. The length and thickness of the branches are proportional to the number of the loci differing between two profiles. The color code used reflects the origin of the isolates: light blue, human; purple, pig; green, cattle; red, chicken; yellow, turkey. Halos indicate different clonal complexes.

