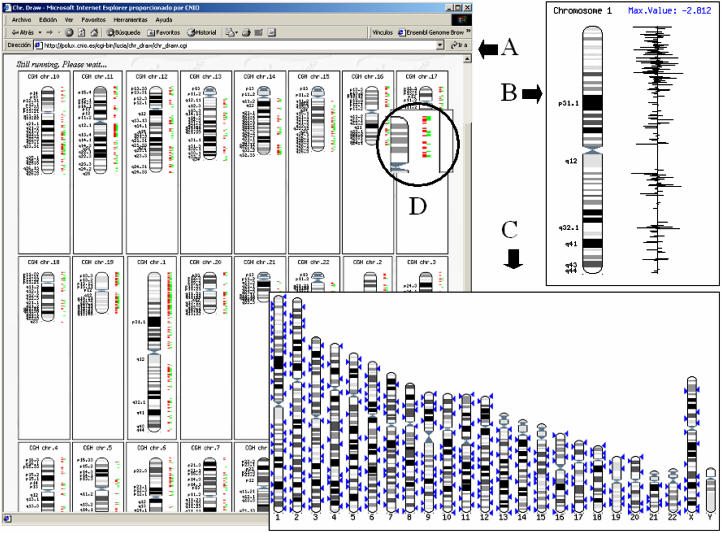
Figure 2.
Results of the InSilicoCGH module. Three different views are available: (A) CGH, which mimics a CGH representation by plotting in different colours overrepresented and underrepresented matches; (B) lines, which correspond to a bar graph of the hybridization values, plotted in the coordinate chromosomes; and (C) karyotype, that generates a representation with the appearance of a karyotype in which probes with hybridization values over a given threshold are mapped. There are different options for the representations, and plotting multiple arrays is possible. (D) Within the circle the effect of the magnifier tool can be seen. The magnifier allows to obtain a magnified view a any part of the representation.

