
Figure 1.
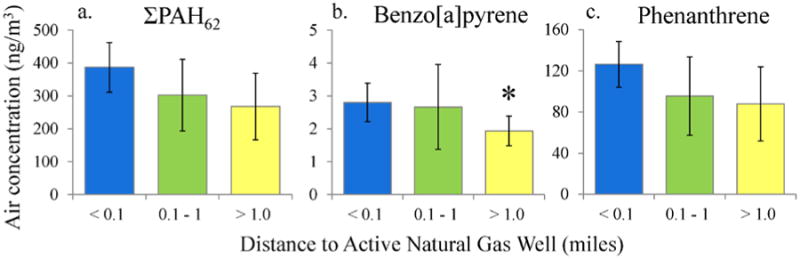
Average PAH concentrations grouped by distance to the closest active natural gas well. a. Sum of 62 PAHs, b. benzo[a]pyrene, and c. phenanthrene. Error bars represent one SD. Asterisks indicate significant differences, p <0.05. The three distance groups are close (n=5), middle (n=12), and far (n=6), defined in the text.