
Figure 2.
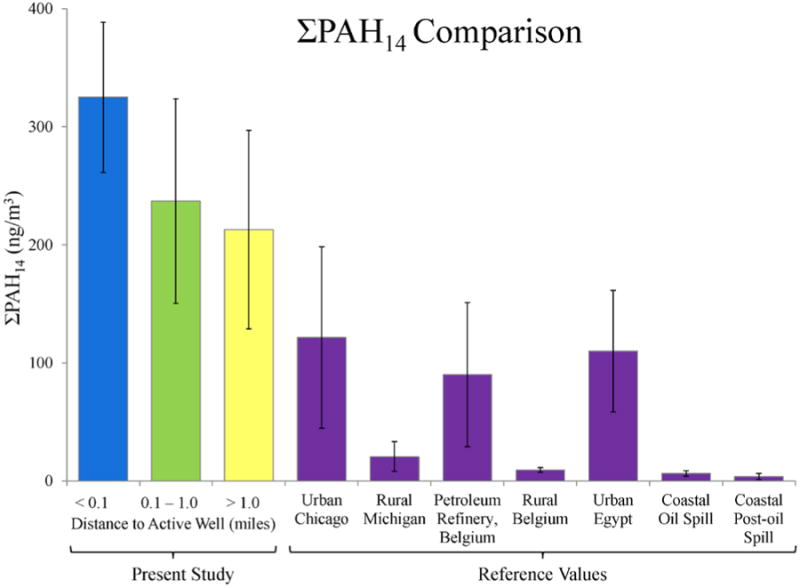
Average sum of 14 PAHs, grouped by distance to the closest active natural gas well, with comparisons to previous studies29, 44-46. All data are vapor phase PAHs. The three distance groups in the present study are close (n=5), middle (n=12), and far (n=6), defined in the text. Error bars represent one SD.