
Figure 3.
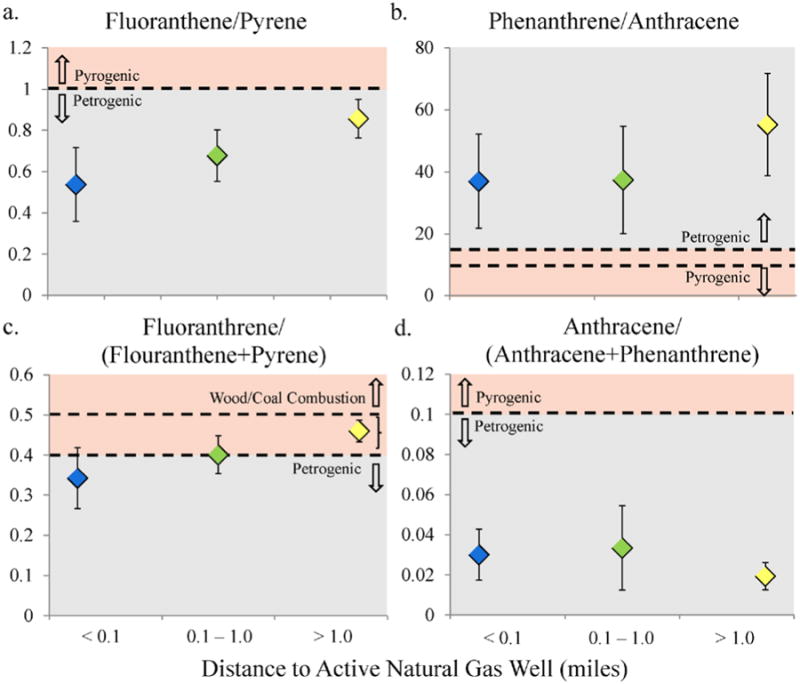
Petrogenic vs. pyrogenic sourcing ratios, grouped by distance to the closest active natural gas well. a. Fluoranthene/pyrene, b. phenanthrene/anthracene, c. fluoranthene/(fluoranthene+pyrene) and d. anthracene/(anthracene+phenanthrene) ratios. Pyrogenic and petrogenic thresholds are defined in text. The three distance groups are close (n=5), middle (n=12), and far (n=6), defined in the text. Error bars represent one SD.