
Figure 4.
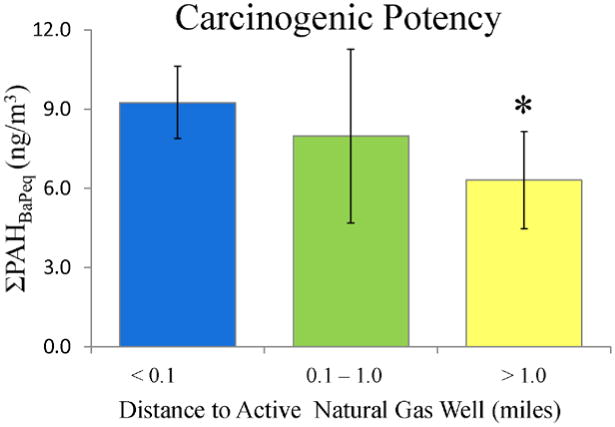
Average carcinogenic potency of measured PAHs, grouped by distance to the closest active natural gas well. The three distance groups are close (n=5), middle (n=12), and far (n=6). Error bars represent one SD. Asterisks indicate significant differences, p <0.05.