
Figure 4. The Pattern of Nuclear BZR1 Is Modulated by Auxin.
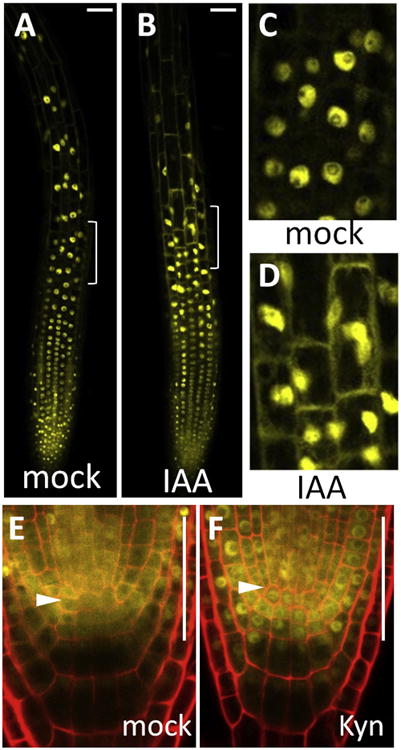
(A–D) BZR1-YFP localization pattern in the epidermis after 5 hr treatment with mock (A and C) or 5 μM IAA (B and D).
(C and D) Zoomed-in views of the transition zone in (A) and (B) as indicated by white brackets.
(E and F) BZR1-YFP localization pattern in the QC after 24 hr treatment with mock (E) or 25 μM auxin biosynthesis inhibitior (Kyn) (F). Arrowheads indicate QC cell layer.
Scale bars represent 50 μm. See also Figure S4.